
Commercial Integrated Permeate Channel Ultrafiltration membranes: Design, Modelling and Performance
Abstract
Submerged ultrafiltration membrane modules for use in wastewater treatment have been practiced globally for several decades and is becoming the standard for water reuse applications. In this paper, the characteristics of the unique and robust Integrated Permeate Channel (IPC®) membrane are presented for membrane bioreactor (MBR) applications. The design choices made during the 10 year development of the IPC® membrane translate in key product attributes that the end-users are looking for: a high capacity of clean permeate per footprint at the lowest cost of total ownership over the lifetime of the product.
1. Introduction
Integrated permeate channel (IPC®) membranes are a special class of robust ultrafiltration membranes that are produced and commercialized by Blue Foot Membranes NV. The original development and features of the IPC® membranes in membrane bioreactor reactor (MBR) applications have been described by Doyen et al. [1] on lab-scale. These membranes have shown broad potential usage in algae harvesting, described by T. De Baerdemaeker et al. [2] and in industrial fermentation bioreactor, described by A. Mahboubi et al. [3]. In this paper, some mechanical properties of the commercial IPC® membrane, the modelled behavior and examples of the industrial use in full scale MBRs, are described for the first time.
The IPC® membrane consists of an open 3D spacer fabric on which a polyvinylidene fluoride (PVDF) polymer solution is directly coated. This integrated composite structure undergoes phase inversion and creates a membrane through non-solvent induced phase separation (NIPS). This unique production process creates a mechanical anchoring of the spacer fabric inside of the PVDF membrane layer and causes unparalleled mechanical strength. In this paper, some of the unique mechanical attributes that characterizes the IPC® membrane product will be explained.
The individual flat sheets IPC® membrane envelopes are placed with pre-defined spacing in membrane modules. They sit on an aerator box containing a set of aerators that produce medium size air bubbles. Effective air scouring is one of the most important conditions for reliable MBR performance. Optimal scouring means that bubble-induced shear over the membranes and across the module meets a threshold value and is as homogeneous as possible, minimizing the risk of local sludge dewatering and/or membrane fouling. Computational Fluid Dynamics (CFD) is used to model the aerator efficiency and also to model the backwash pressure inside of the IPC® envelope. Advanced CFD was used as a virtual 3D piloting tool. Advanced CFD is characterised by the integration of process phenomena in CFD as described by Nopens et al. [5, 6]. In this case, process phenomena to include were the 2-phase interactions of bubbles and water, and the elevated liquid density due to the high mixed liquor suspended solids (MLSS) concentration typically present in MBRs which is described elsewhere by Neves do Amaral et al. [7]. Rehman-Nopens curves were used to transform the large amount of local shear values into clear graphs. They are a cumulative representation of a certain variable of interest, calculated by an advanced CFD model by Rehman et al. [8].
Back-pulsing is a widely used technique in hollow fiber ultrafiltration membranes. In flat panel membranes, back-pulse pressures are very limited due to the “laminated” construction. In a recent paper by Lüken et al. [4] the colloid filter cake motions and removal of filter cake in membrane cleaning procedures was studied and they concluded that backwashing removes the cake in coherent pieces and their sizes depend on the previous cake build-up. In the case of IPC® membranes, the large permeate channel allows for a good and efficient back-pulsing up to 2 bar, which is modelled by CFD.
The third part of this paper, a full-scale operation at a rendering plant is presented. This example shows that a high capacity per footprint can be achieved by high net flux rates. In the example provided, one of the lowest values of the specific aeration demand per volume permeate produced, is presented [9]. A lower cost of total ownership will be achieved by lower overall equipment cost, and lower operational expense.
2. Integrated Permeate Channel (IPC®) Membrane Design and Mechanical Properties
2.1 Integrated Design
IPC® membranes are produced by using a unique casting technique that forms a 3D composite structure where the textile is embedded in the membrane structure once it is formed (Figure 1). The PVDF polymer that is used has an extremely high molecular weight which provides a very strong material and a very high chlorine tolerance up to 1 MM ppm.h as is documented by Arkema [10].
These membrane envelopes are stacked and potted into a modular and stackable module design where all permeate channels collect in a permeate collection chamber at the side of the module. These modules are stackable in multi-decks where all permeate collection pipes are connected as one integral permeate extraction pipe. This enables identical trans-membrane pressure (TMP) over the whole module stack in both suction and backwash mode.
2.2 Mechanical Properties
There are multiple mechanical stresses applied on a membrane during operation. In flat panel submerged modules, in all cases, the membrane is cast on a classical support “paper” and this is attached on the supporting permeate extraction plate or knitted textile either by glue, heat seal or ultrasonic welding. Contrary to IPC ® membranes, typical flat panel membranes are not integrally joined with the extraction plate but only sparsely connected. This can cause mechanical stress on the membrane-support interface.
During relaxation or when there is air in the module, caused by expanded dissolved air, the internal pressure at the top of the membrane envelope causing the membrane to push-out from the plate at the top. The same happens at the bottom during lifting of wetted modules. The latter is mostly mitigated by opening a valve. In case the support plate is compressible textile, the permeate channel can contract and becomes smaller which causes more resistance in the permeate extraction channel. At extreme conditions, it can collapse. Similarly, the risk of delamination of the membrane and support structure makes backwashing near to impossible in any practical way. Both mechanical risks lead to a smaller operational TMP window. The IPC® design tackles these challenges by a non-compressible 3D fabric and integrated membrane envelope, combined with a very strong and stress-free sealing of the membrane on all sides.
2.2.1 Compressbility
In the following test, three materials are compared under identical condition using ISO 5084 (1996) test method at Centexbel (Center for Textile in Belgium). In this test, 5 samples are compressed using a round compression stamp (diameter 20 mm) during 30 s in a lab environment using a Twing Albert Frank type 81828 and applied pressures were 0.1; 0.4 and 5 N.cm-2. This corresponds to 10, 40 and 500 mbar.
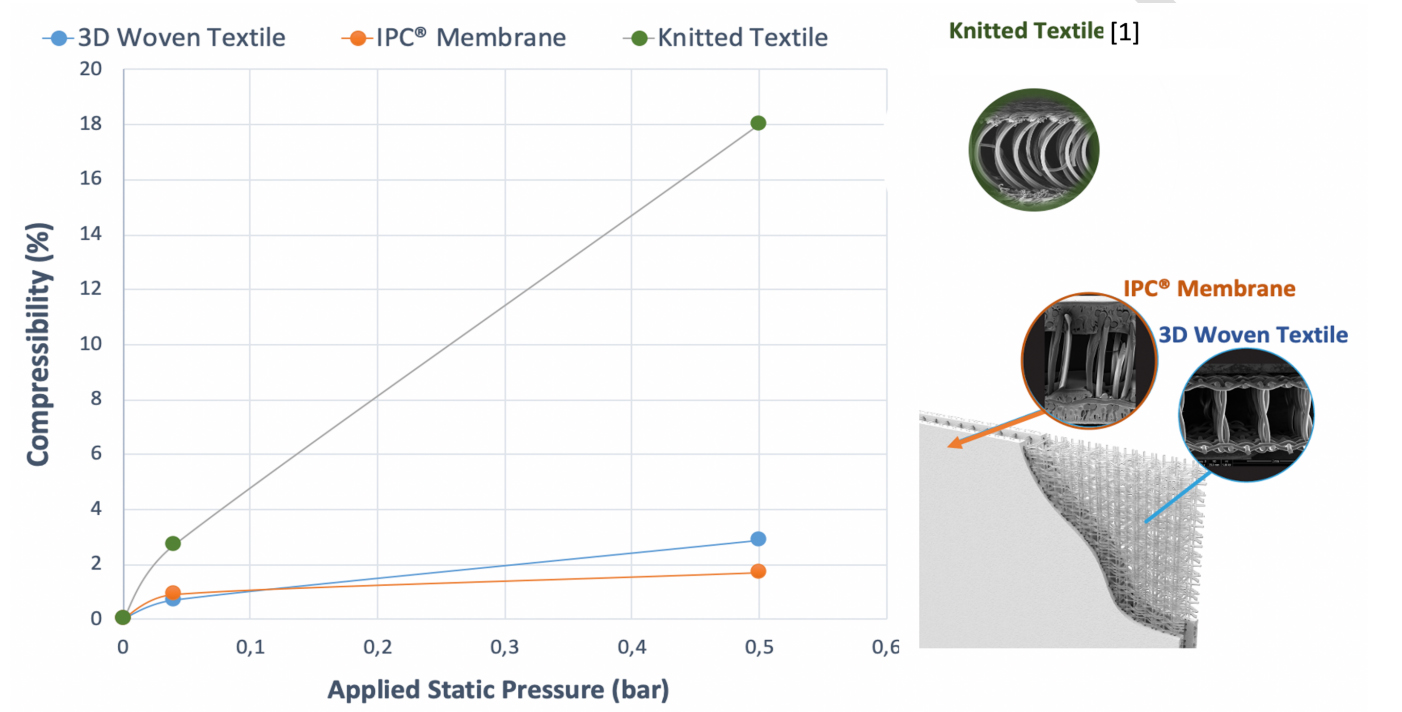
The following three materials are used: the original knitted textile that was described by Doyen et al. [1] is compared with the 3D woven spacer fabric that is currently used as well as the IPC® membrane (which embeds the 3D woven spacer fabric).
It is clear from the compression data, presented in Figure 1, that the 3D woven spacer fabric that is currently used and the IPC® membrane show very limited and stable compressibility (< 3%) within the tested pressure range. The original knitted fabric, that was envisioned during the original design of the IPC® membrane product, shows a clear increase of compressibility up to 18% at increasing applied pressure up to 500 mbar.
2.2.2 Stress Free Sealing Design
Every membrane, integrated in a module, suffer from stresses at the sealings or seams which create material fatigue and eventually material rupture or some form of delamination. The key to a robust product design is to ensure the correct hardness and chemical interaction of the applied glue, and to design the module in such a way that stresses at the sealings’ interface are reduced to a minimum. The IPC® membrane module is potted by a two component chemically stable PU that anchors into the fibers of the 3D support structure creating a very strong mechanical anchorage.
Furthermore, the membrane envelopes are fixed in place in the center by a comb to ensure even air distribution 100% of the time and which allows the IPC® membrane envelope to vibrate (caused by the turbulence of the aeration) with a very low amplitude in the center (1 mm). This causes very limited to no mechanical stress at the membrane potting interface, similar to ceramic plate module construction.
2.2.3 Tensile Strength after Chemical Exposure
During MBR chemical cleaning operation, the membrane is exposed mostly to NaOCl. In the study described below, the U-cap sealing of the PVDF membrane envelope was tested under lap shear tensile test after exposure to very high NaOCl concentrations (3,000 – 1.5MM ppm.h). The lap shear test was established by movement of the upper clamp at a speed of 2 mm.min-1.
In Figure 2, the tensile force is presented for the 5 different samples. The tensile force data indicate that the exposure of the U-CAP glue seal remains strong and intact over the whole exposure range to NaOCl. The variability is probably due to the manual preparation of the samples that were exposed to NaOCl.

3. CFD Modelling of IPC® Membrane and Module
3.1 Advanced 3D Aeration CFD Modelling
Computational Fluid Dynamics (CFD) was used to model the aerator efficiency and to model the backwash pressure inside of the IPC® envelope. In this case, important design and operational settings were the aerator design, the bubble size and air flow rate. In the 3D CFD model, the following variables were simultaneously accounted for: hydrodynamics, sludge density, either coarse or fine bubble aeration to achieve accurate flow simulation and shear calculation between the flat sheets. Multiphase CFD modelling was performed using Ansys Fluent. A very fine mesh (1mm) was used between the membrane sheets to obtain highly accurate shear calculation.
3.2 Processing and Presentation of the data
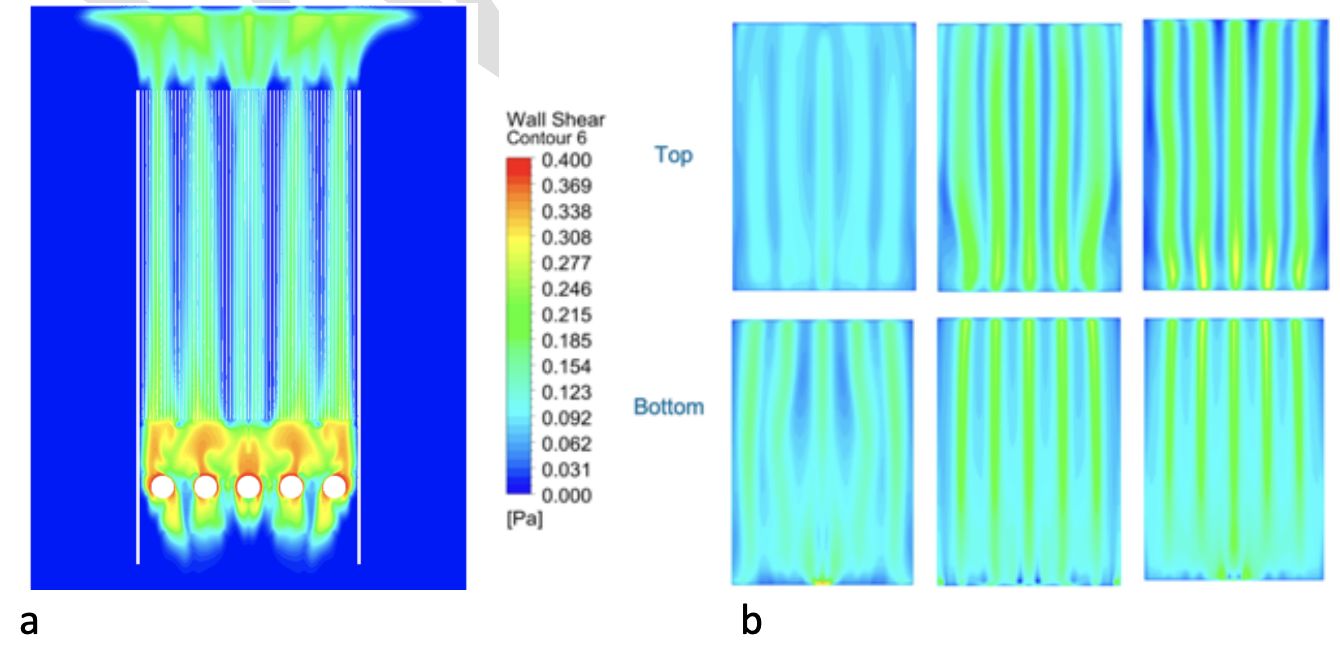
Clear visualization and quantification of shear over 30+ individual membranes within one module was crucial to make model-based design decisions. A typical visualization of local shear on one individual membrane sheet is illustrated in Figure 3. Gas hold-up volume and wall sher is show in Figure 3 a and b respectively.
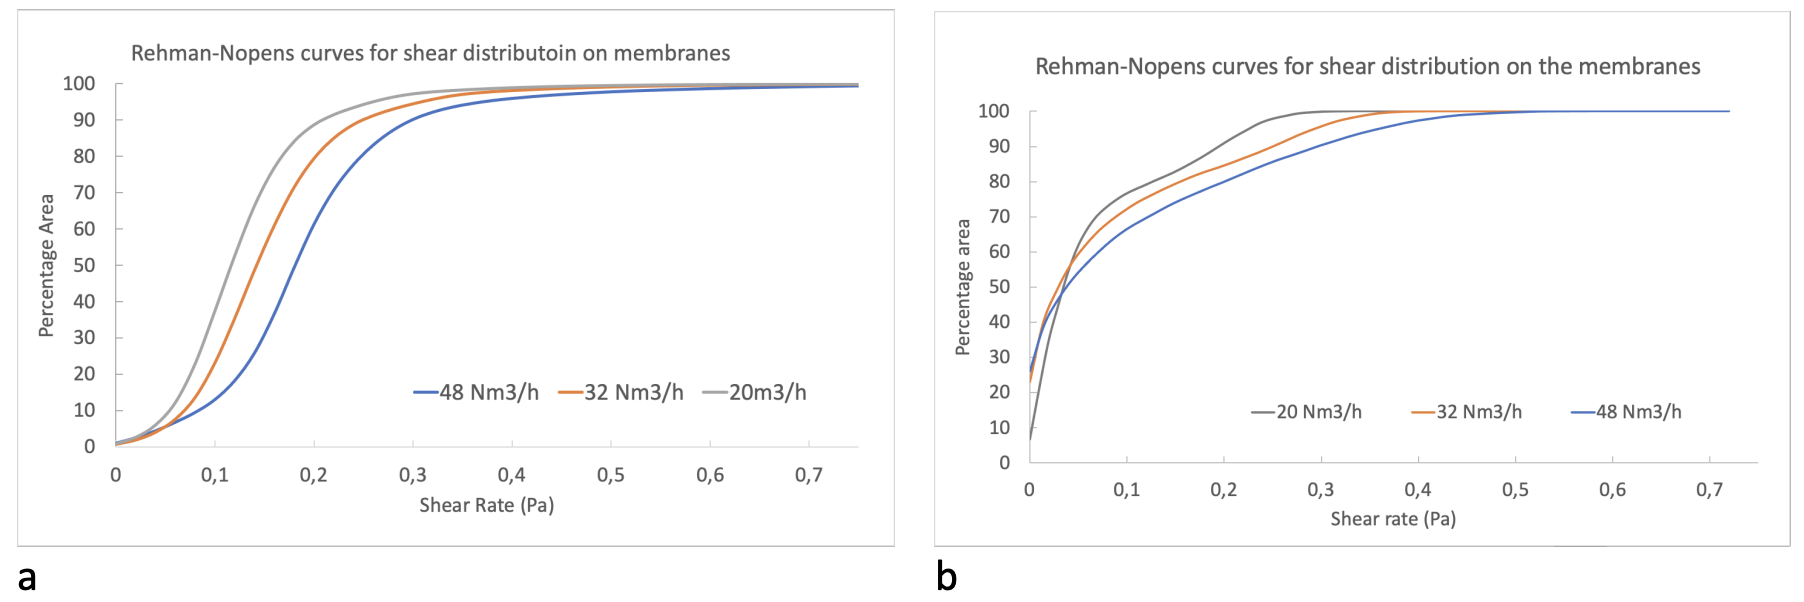
In this case, 3D CFD results for shear rate were translated to clear 2D graphs using Rehman-Nopens curves. In this way, local shear of 30+ membrane sheets could be visualized (Figure 4 and 5). Each sheet is one curve with shear rate as a function of fraction of membrane area. The steeper the curve, the more homogeneous the shear (i.e., every region on a sheet has a similar shear). The more the curve shifts to the right, the higher the overall shear.
3.3 Results
3.3.1 The Impact of Bubble Size
Fine and coarse bubble aerations were compared in terms of shear stresses at the membrane surface. Rehman-Nopens curves for all the individual sheets are given in Figure 4. These curves clearly show the higher homogeneity using fine bubble aeration (Figure 4a) in comparison with coarse bubble aeration (Figure 4b). Using coarse bubble aeration, some of the membranes (located on top of the aerators) have very high shear while some membranes have almost none (the steep red-orange curves in Figure 4b). This local high shear is caused by the prominent short-circuiting of the coarse bubbles.

When fine bubbles aerators are being used, the vertical rising patterns is clearly visible (Figure 3 a) and the bubbles distribute more evenly across the membrane surface. This is represented in the Rehman Nopens curves in Figure 4a, that shows a more homogeneous shear over the full module suggesting that local fouling would be less likely to occur.
3.3.2 The Impact of Gas Flow Rate
Different individual membranes are visualised for fine bubbles aerators at different gas flow rates. The general trends do not differ with increasing the gas flow rates, coarse bubble aeration still leads to high inhomogeneity, with some membranes having very low and others having very (local) high shear. The average overall shear rate is displayed by the Rehman-Nopens curves for the full modules in Figure 5. In this figure, coarse and fine bubbles differed significantly in terms of average shear distribution over the full module. The shapes of the curves (i.e., the shear patterns) do not change with increasing gas flow rates, although they shift to the right, indicating higher overall shear.
3.3.3 CFD Flow Simulation of Internal Back pulse Pressure
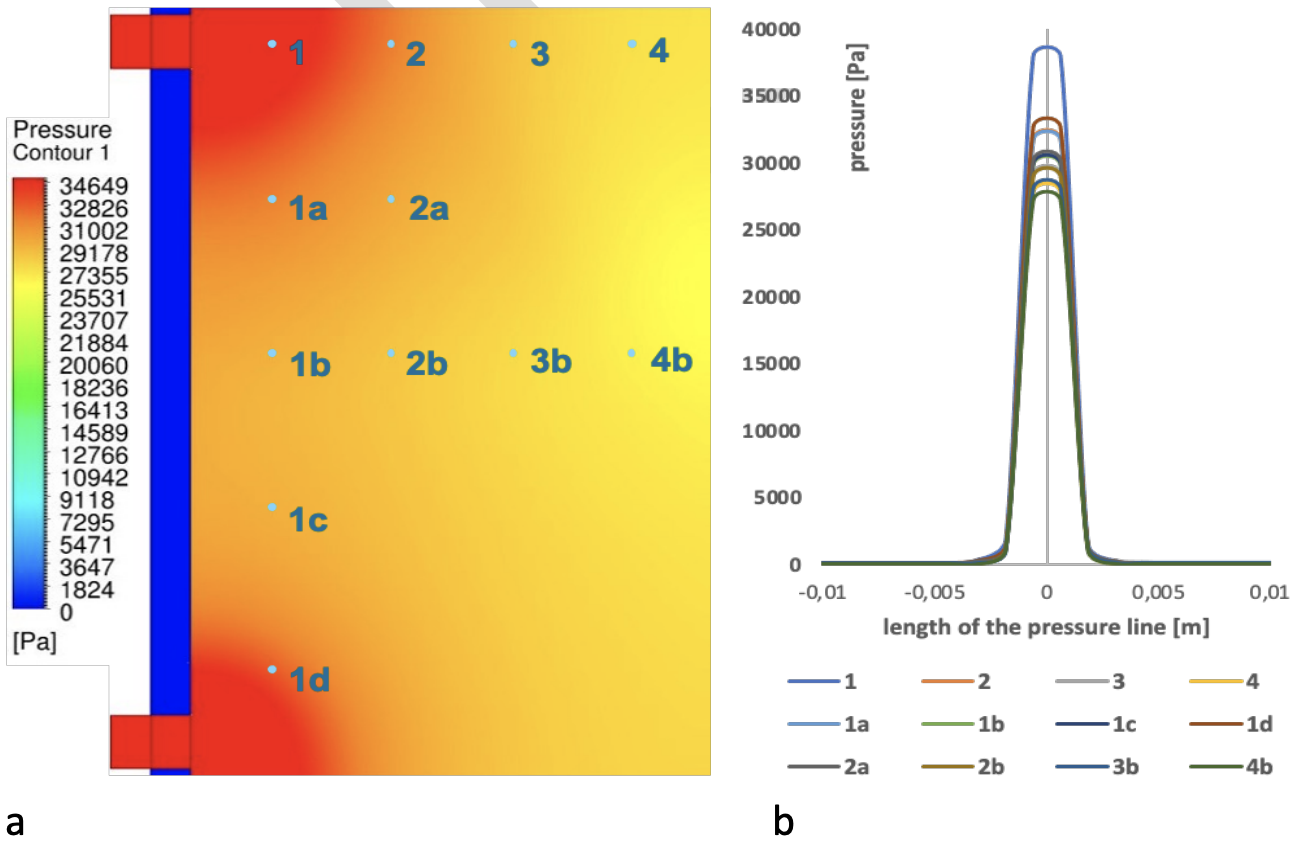
The mechanical robustness of the IPC® membranes allows for back pulse or high-pressure backwash at elevated pressures up to 2 bar. In MBR operation, the back pulse flow rate used in an IPC® membranes equals two times the forward flow rate (2 time the gross flux) for a short period of time, typical 15 to 30 sec. The open structure of the permeate channel allows for a very even pressure pulse in the whole membrane envelope. The CFD modelling has simulated this pressure drop in a membrane envelope using the following characteristics: back pulse pressure of 350 mbar, permeability of the membrane layer of 1,500 l.m-2.h-1.bar-1 and thickness of the channel of 2mm.
In Figure 6, the pressure loss is calculated from the entrance of the membrane permeate channel (during the back-pulse) until the pressure pulse reaches the other side of the lPC® membrane envelope. Under these conditions, the calculated data shows a very even pressure distribution within the channel, only losing about 25-30% of pressure at the far edges (point 4 and 4b on Figure 6) of the membrane envelope compared to the entrance of the two permeate manifolds (point 1 and 1d on Figure 6). This has several significant advantages on both a membrane and a module and on a MBR system level which differentiate the IPC® membrane technology.
On a membrane level, the high pressure back pulse is possible even with a high permeability membrane without losing the mechanical cleaning efficiency of backwash. This is a very effective pore-cleaningmechanism which, in this configuration, is efficient over the whole membrane sheet. The same holds forchemical enhanced backwash (CEB) cleaning. Also, in this chemical cleaning operation, all pores will bechemically cleaned with the same volumetric flow of cleaning chemicals over the whole membrane sheetwhen all membrane pores are all evenly fouled.
On a module level this characteristic is important because all membrane sheets have this same open connectivity to the permeate collection chamber whether the module is a stand-alone module, a doubledeck or a triple deck. This effective backwash works identically over the whole height of the module stack.
On a systems level, the stable and effective mechanical and chemical cleaning method, enables to clean the membranes in place and allows the use of significant backwash pressure. In large commercial installations up to 1 bar back pulse of clean water during start-up has been proven.
In comparison to most flat panel membrane, a slight backpressure up to 150 mbar in some cases is allowed, however this has limited effect on mechanical cleaning of all pores from the inside out. The low pressure limit prevents the user from back pulsing significant volume of permeate through the pores. In comparison with classical submerged hollow fiber membranes, one can say the inner diameter of the hollow fiber prevents an even pressure drop over the length of the fiber. This prevents an even cleaning from the inside-out during backwash especially in the center of the fiber. In this location, one can argue that more mechanical cleaning is happening caused by the turbulence and wake effects in the MBR tank during operation however, these are physical events at the outside of the fiber and have no effect in the pore.
4. Integrated Permeate Channel Membrane Performance in MBR
4.1 Operational Filtration Cycle
A typical operation cycle is similar to a hollow fiber MBR operation cycle. During this filtration cycle, step 1 to 4 is performed, and the duration of the cycle can vary between 5 and 20 minutes depending on the fouling propensity and the flux rate.
The following steps make up the filtration cycle of 10 minutes:
- Filtration under suction pressure for 9 min and 20 sec (=W).
- A short time to change the valves for 5 sec (=X)
- A backwash cycle at 2 times the forward flux for 25 sec (=Y)
- A short relaxation cycle for removal of the dirt out of the modules and changing the valves of 10
sec (=Z)
Is clear the sum of W+X+Y+Z = the total length of the cycle of 10 min in this case.
In Figure 7, the operational data of a 5 min filtration cycle, including gross flux, backwash flow and filtration pressure as a function of time (s) is presented. In this operational data set, that originates from a running pilot test at a fishmeal plant, the data listed in Table 1 were recorded or adjusted as a setpoint. It is clear from Figure 8 that the peak pressure during the short and vigorous pack pulse reaches 320 mbar in this operation while the back pulse flow used in each back pulse (80 l.m-2.h-1) is approximately two times the average gross flux (41 l.m-2.h-1).
| Operational setpoint/measurement | Data | Unit |
| Flux (Gross) – setpoint | 41.2 | l.m-2.h-1 (average in one cycle) |
| Flux (Net) | 32 | l.m-2.h-1 (average in one cycle) |
| Filtration pressure | -150 – 190 | mbar |
| Backwash flux – setpoint | 80 | l.m-2.h-1 |
| Back pulse peak Pressure | + 320 | mbar |
| MLSS – setpoint | 15,400 | mg.l-1 |

4.2 Full Scale Example and Advantages
In a large-scale operation, all of the above mentioned advantages come together and translate into important performance characteristics for the end user, such as capacity/footprint at sustained elevated fluxes, low specific-aeration-demand per volume of permeate produced (SADp), and low aeration energy.
In the commercial reference presented here, the packages MBR plant is located in Denderleeuw Belgium and is treating wastewater that originates from an animal rendering plant. This wastewater is rich in fat, high N concentration and is known to be difficult to treat.
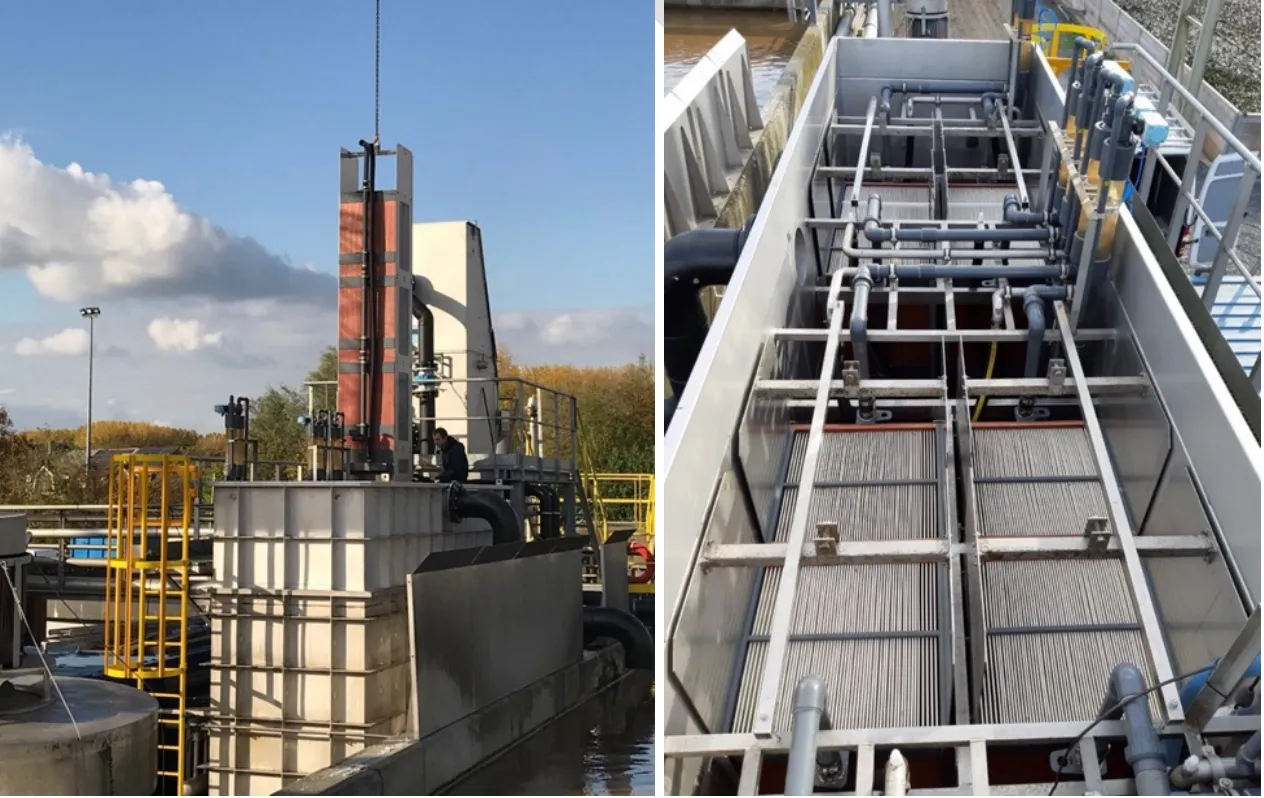
The existing wastewater treatment plant has a pre-flotation operation and is designed as a racetrack reactor with aerated and non-aerated zones. Sludge is pumped in the reactor and is returned by gravity overflow. In front of the MBR, a 1 mm bow sieve is used to ensure all hairs are removed. Typically, a 2- or 3-mm sieve is sufficient when using IPC® membrane modules. In Figure 8, the packaged MBR plant is shown which has 8 towers of each 3 modules and has a total membrane area installed of 1,850 m².
This industrial MBR plant in in operation since October 2019 and a full year data set is presented in Figure 9. On average, this operation runs at a net capacity of 40 to 50 m³.h-1. This corresponds to a net flux between 20 and 25 l.m-2.h-1. During peak loads, this plant can operate for more than a week at a maximum net capacity of 59 and 55 m3.h-1 as was demonstrated during January and March 2020.
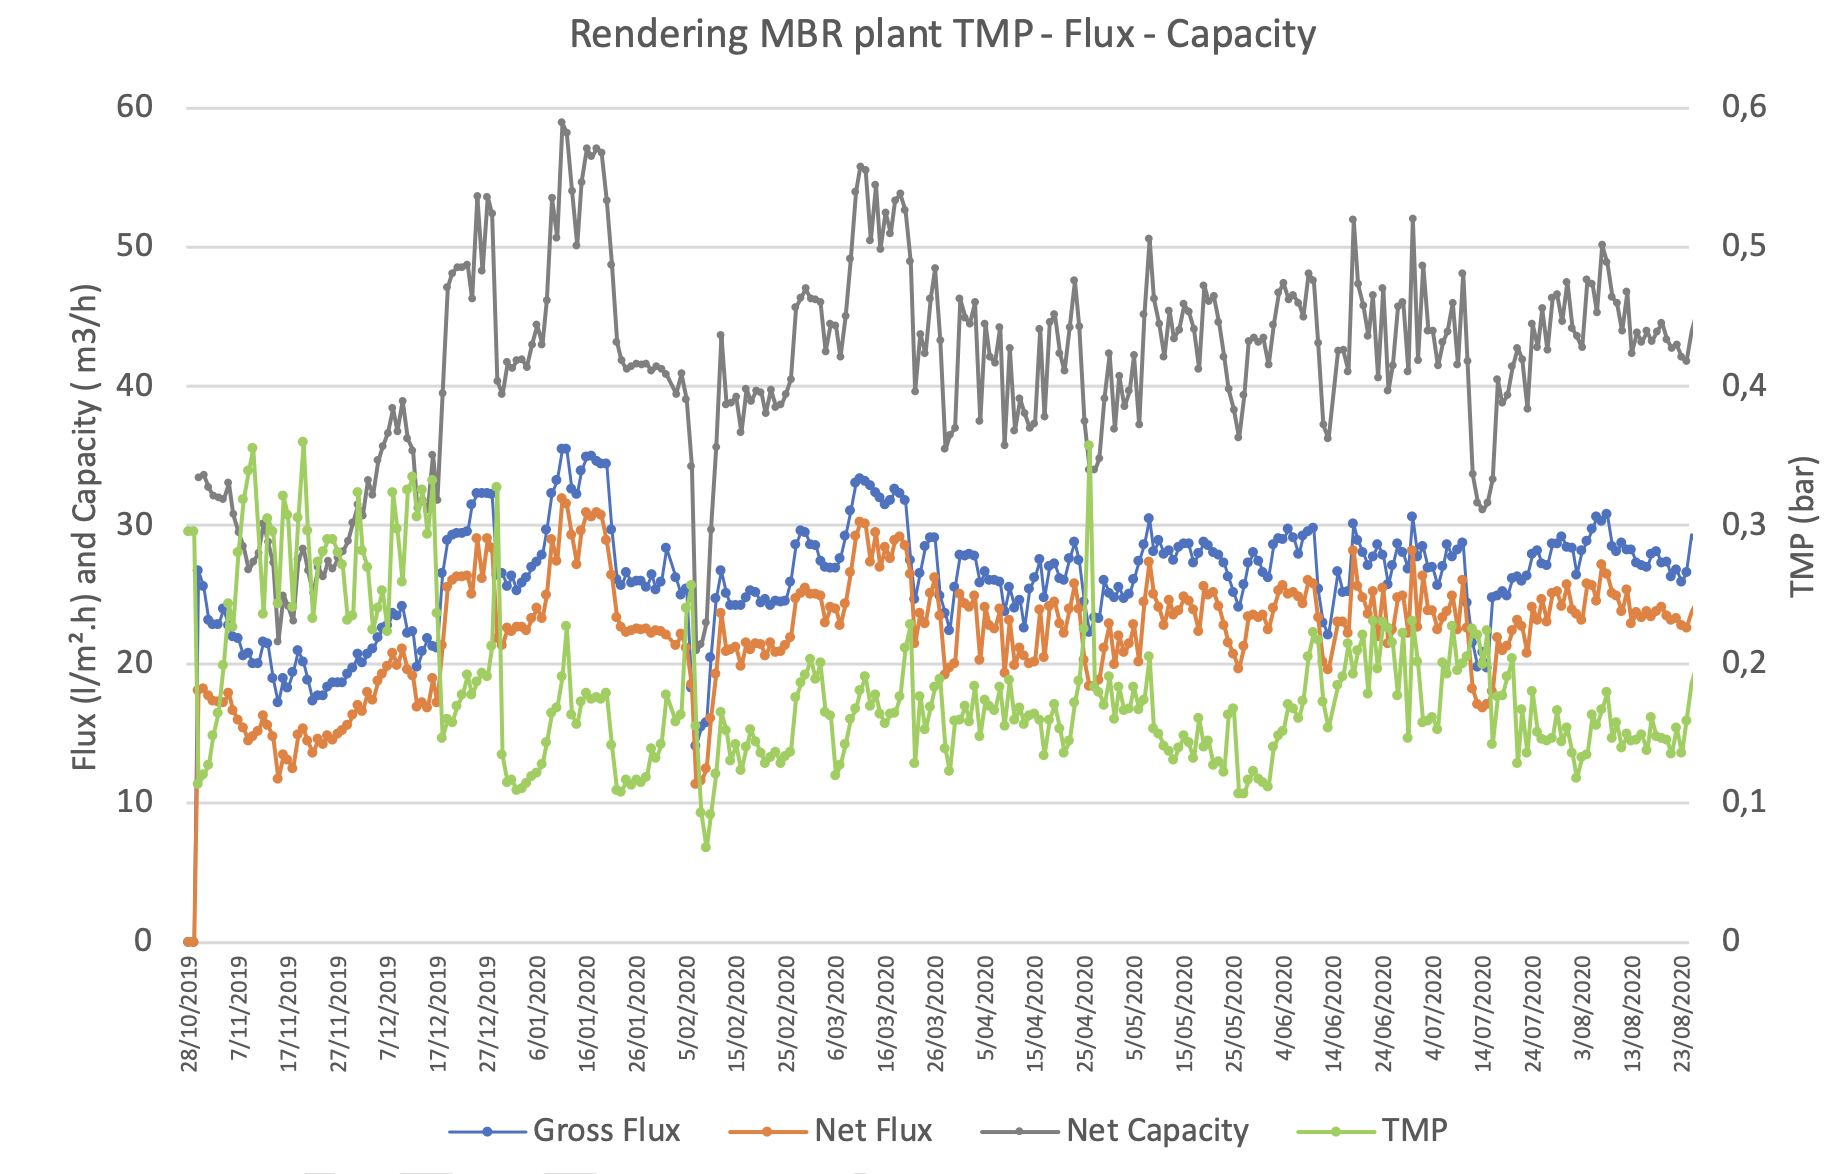
19-20) operation.In Table 2, the operational setpoints and filtration cycle settings are shown and in Table 3, a summary of the operational results are presented. The design capacity of this plant is 60 m3.h-1 which is achieved at an operational net flux of 33 l.m-2.h-1. The membrane tank has a surface area of 9.6 m2 and as a result, the capacity per footprint reaches 6.25 m3.m-2.h-1. These 8 IPC® module towers sit on 8 aeration boxes that each consume 50 Nm3 Air.h-1. As a result, the SADp is calculated to be 6.7 Nm3 air.m-3 permeate, and a SED of < 0,6Kw.h.m-3 according to the system operator, which indicates a very energy efficient system [9].
| Operational setpoints of filtration cycle | Data | Unit |
| Filtration time | 17.25 | min |
| Switching valves | 10 | sec |
| Backwash time | 25 | sec |
| Switching valves / Relax | 10 | sec |
| Backwash flux | 80 | sec |
| Backwash flow capacity | 22.5 | l.m-2.h-1 |
| MLSS | 6,000 – 10,000 | mg.l-1 |
| Operational setpoints / results | Data | Unit |
| Flux (gross) – setpoint at peak | 34 | l.m-2.h-1 |
| Flux (net) range (march – sept 2020) | 20-30 | l.m-2.h-1 |
| Permeate peak flow capacity | 60 | m3.h-1 |
| Recirculation flow capacity | 150 | m3.h-1 |
| Total air scour volume | 400 | Nm3.h-1 |
| Permeate capacity / footprint | < 6.5 | m3.m-2.h-1 |
| Specific aeration demand (SADp) | < 7 | Nm3 Air.m-3 permeate |
5. Conclusions
To conclude, the data presented above support the notion that the characteristics of the Integrated Permeate Channel (IPC®) membrane are unique and that IPC® membranes are a special class of robust ultrafiltration membranes that can have broad potential usage when dealing with wastewater or difficult to treat feed waters. The mechanical robustness, that allows for back-pulse at pressures up to 2 bar, delivers a uniquely designed MBR membrane product. All design decisions translate the key product features that end-users are looking for: high capacity of clean permeate per footprint and lower total cost of ownership over the life of the product.
Acknowledgement
We are very grateful and acknowledge our partners for their contributions to this paper. Specifically, we thank Roartis for the mechanical tests, Centexbel for the compression tests, AM Team for the fruitful discussion and CFD simulations and Pantarein Water for the availability of the full-scale data.
Abbreviations
| CEB | Chemical enhanced backwash |
| CFD | Computational fluid dynamics |
| IPC | Integrated permeate channel |
| MLSS | Mixed liquor suspended solids |
| MBR | Membrane bioreactor |
| NIPS | Non-solvent induced phase separation |
| PES | Polyether sulphone |
| PU | Polyurethane |
| PVDF | Polyvinylidene fluoride |
| SED | Specific energy demand (for aeration) |
| SADp | Specific aeration demand per volume permeate produced |
| TMP | Transmembrane pressure |
| VITO | Flemish Institute for Technological Research |
References
- W. Doyen, W. Mues, B. Molenberghs, B. Cobben, Desalination 2010, 250, 1078-1082. DOI: 10.2016/j.desal.2009.09.112
- T. De Baerdemaeker, B. Lemmens, C. Dotremont, J. Fret, L. Roef, K. Goiris, L. Diels, Bioresource Technology 2013, 129, 582-591. DOI: 10.2016/j.biortech.2012.10.153
- A. Mahboubi, S. Elyasi, W. Doyen, H. De Wever, M.J. Taherzadeh, Process Biochemistry 2020, 92, 409-416. DOI: 10.2016/j.procbio.2020.01.031
- A. Lüken, J. Linkhorst, R. Fröhlingsdorf, L. Lippert, D. Rommel, L. De Laporte, M. Wessling, Sci Rep 2020, 10, 20043,. https://doi.org/10.1038/s41598-020-76970-x
- I. Nopens, U. Rehman, in Advances in wastewater treatment (Eds: G.Mannina, G. Ekama, H. Odegaard, G. Olsson), IWA Pubblishing, London, UK 2018.
- I. Nopens, D. sudrawska, W. Audenaert, D. Fernandes del Pozo, U. Rehman, Water Sci. Technol. 2020, 81(8), 1636-1645. DOI: 10.2166/wst.2020.181
- A. Neves do Amaral, S. Gillot, M. Garrido-Baserba, A. Filali, A.M. Karpiska, B.G. Plósz, C. De Groot, G. Bellandi, I. Nopens I. Takács, et al. Water Sci. Technol. 2019, 80(4), 607-619. DOI: 10.2166/wst.2019.253
- U. Rehman, Next Generation Bioreactor Models for Wastewater Treatment Systems by Means of Detailed Combined Modelling of Mixing and Biokinetics, Ph.D. Thesis, University of Ghent 2016.
- S.J. Judd, Chem. Eng. Journal 2016, 305, 37-45. DOI: 10.1016/j.cej.2015.08.141
- https://www.extremematerials-arkema.com/en/markets-and-applications/water-and-environment/water-filtration-membranes/